Last week a subscriber (DiGiGuy) asked if we could describe a high-level approach how to research a stock on Portfolio Insight. Using ABBV, we begin the process by entering ABBV in the search bar. Then I selected the charting tool, used the total returns template, and compared it to the S&P index (SPY) and the Dividend Aristocrat (NOBL) benchmarks, oftentimes used by dividend growth investors.
ABBV was spun-off by ABT on 1/1/2013 so I adjusted the range to begin 1/1/2013. The graph demonstrates that ABBV has outperformed both SPY and NOBL based on the total trailing returns.
).png)
The annualized returns were 21.45%, 16.51%, 13.59% respectively for ABBV, SPY, and NOBL.
Next, I reviewed ABBV’s historical performance on three key metrics:

Key takeaway: Consistent growth that is expected to continue.

Key takeaway: Further research would be required to understand historical and projected performance.

Key takeaway: An attractive dividend growth stock.
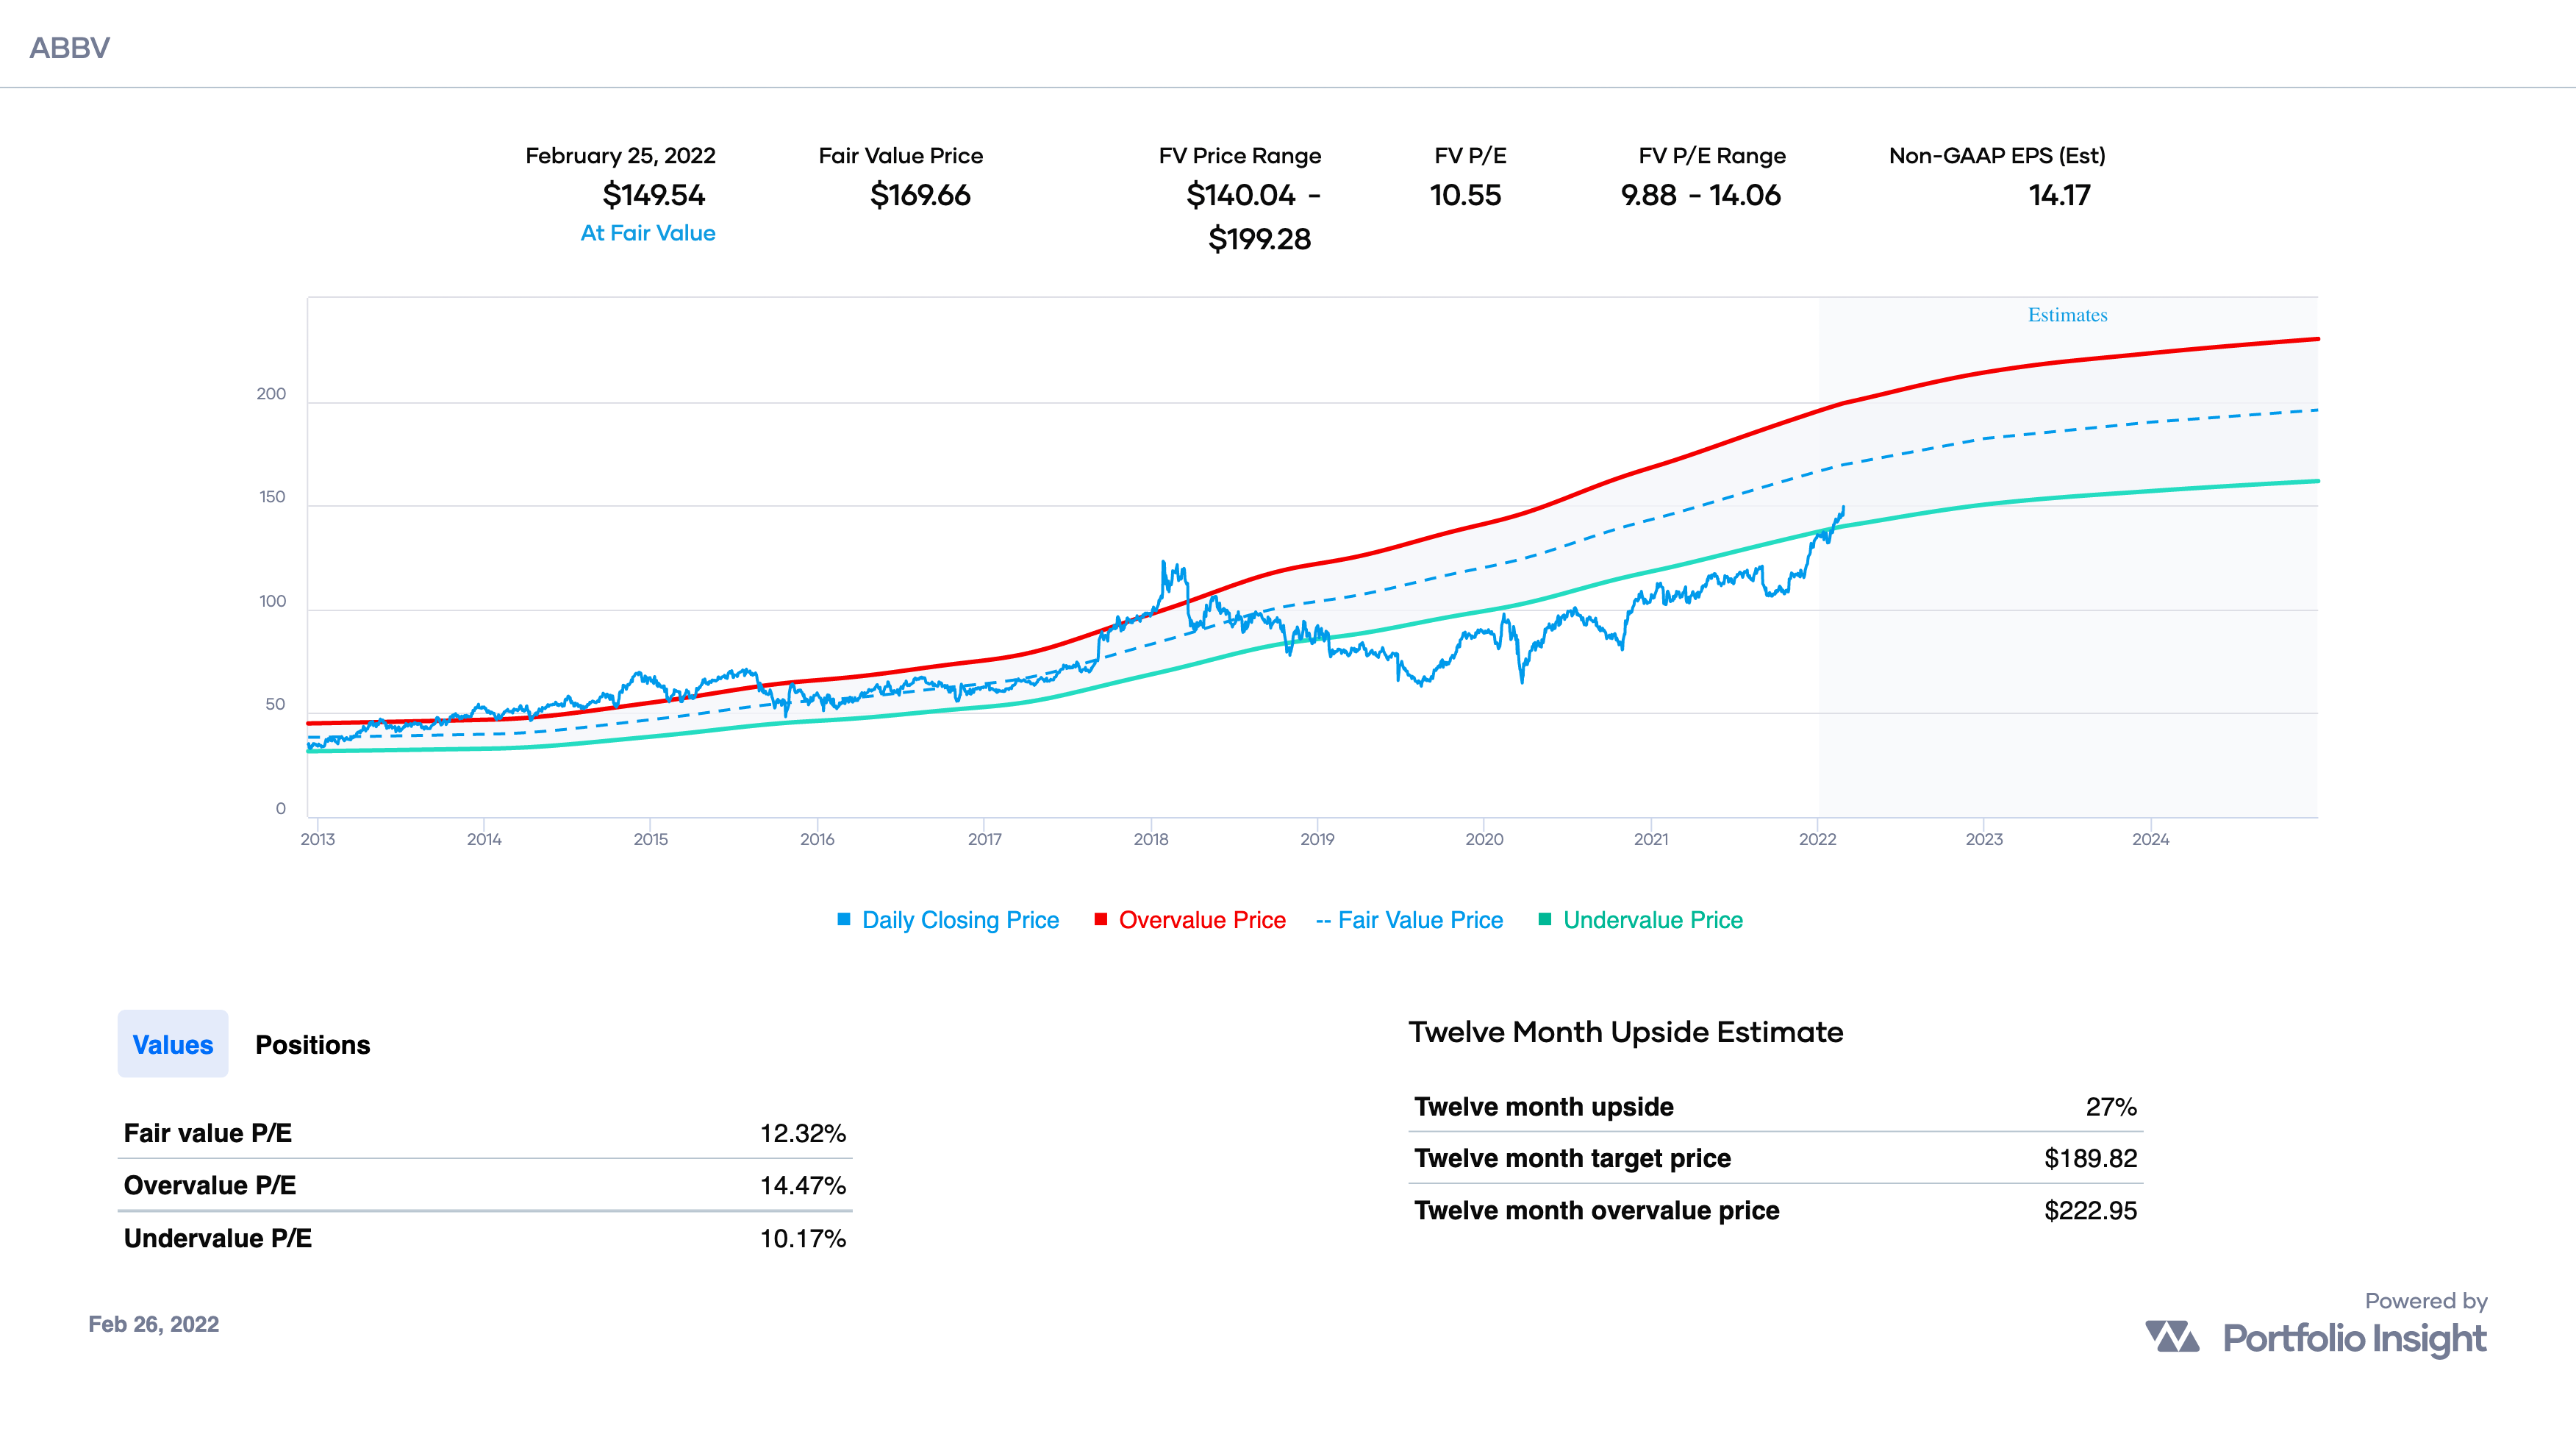
Key takeaway: Undervalued since 2018, with a 12-month upside of 27%.
The review indicates that ABBV has rewarded its shareholders very well since becoming a public company in 2013 (the only fact that is not found in one of the charts). Based on the analysts’ estimates, the performance is expected to continue.
Using Portfolio Insight, a stock can be quickly reviewed ata high level to understand the historical performance, the analysts’ estimates and whether it may be a potential buying opportunity subject to further research. Adding ABBV to your watch list also appears to be a viable option.